22 million fake votes for Putin? How Kremlin rigged the election results 2024
20.03.2024





Experts in statistical analysis have discovered a staggering scale of vote rigging in Russia, marking an unprecedented manipulation in the country's electoral history. Several investigative teams independently counted that at least 22 million votes — a third of the 64,7 million voting ballots cast for Vladimir Putin according to CEC—were cast fraudulently. This revelation does not even account for the additional 4 million votes from the so-called "new territories" of Russia, i.e. occupied Ukrainian regions, nor the 8 million electronic votes.
It was also noticed that the falsifying commissions underestimated Davankov's figures. Programmer and election researcher Ivan Shukshin explains it was falsifications that brought him only third place.
There are various methods of data analysis and statistics that can be used to detect electoral fraud. The Shpilkin method, applied by Shukshin, relies on employing various statistical techniques to analyze election results. It enables the detection of anomalies in voter turnout and voting outcomes, which may indicate electoral fraud.
The Shpilkin method provides a robust framework for scrutinizing election integrity through rigorous statistical analysis. At its core, this approach examines election data to uncover any irregularities that may signal potential fraud. By comparing actual turnout rates with expected norms based on historical data or demographic factors, the method swiftly identifies deviations that demand further investigation.
One key aspect of the Shpilkin method involves scrutinizing voter turnout across different polling stations or electoral districts. By analyzing variations in turnout percentages, the method can pinpoint anomalies that suggest manipulation or coercion. For instance, if a polling station reports an unexpectedly high turnout compared to neighboring areas with similar demographics, it raises suspicion. Similarly, sudden dips in turnout could also indicate attempts to suppress voting or tamper with the electoral process. Such deviations serve as crucial indicators, prompting election observers and authorities to explore the underlying causes, ensuring the integrity and transparency of the process.
Under normal conditions, without interference or falsifications, the graph of election results would have a characteristic shape resembling a two-humped camel-like curve. This pattern is typical of many electoral systems where there is some diversity in voter preferences.
The first "hump" on the graph would represent the area of support for one candidate or party, and the second "hump" for another candidate or party. This means that there are two relatively equal and strong forces vying for victory, which is a normal occurrence in democratic elections.
However, if the graph shows only one "hump" or, possibly, unusual and anomalous changes in voting, this may indicate violations, interference, or falsifications in the election process. Such anomalies may suggest that the voting process was not conducted fairly or that the results were skewed in favor of one side.
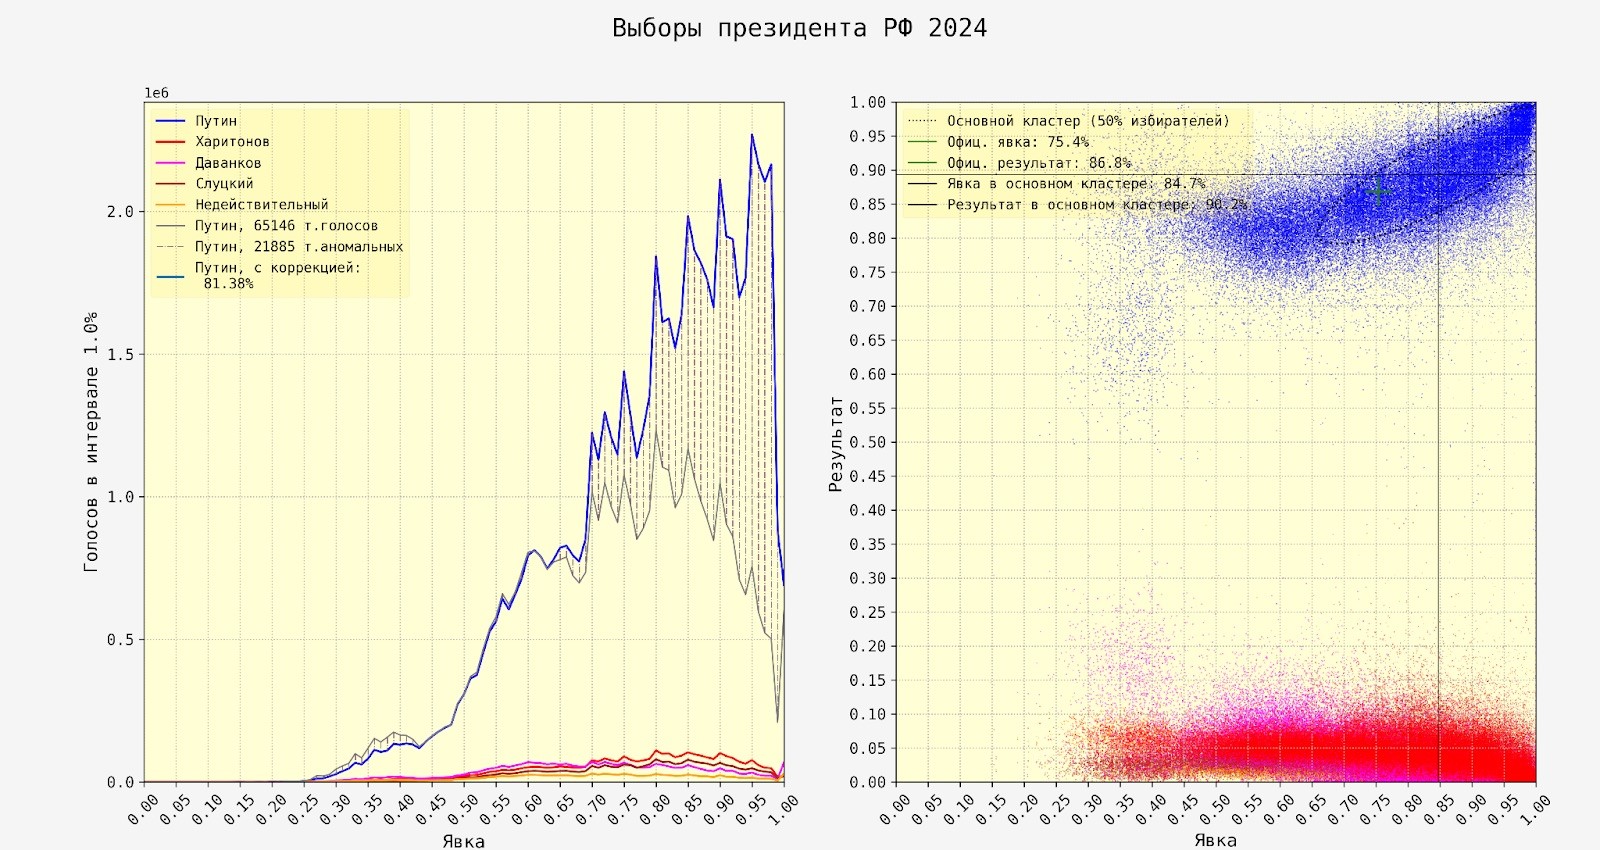
On the left graph, we see one small "hump" on the left(38%), representing the voting results in Moscow. To the right, around a 60% turnout rate, there's another "hump" representing the rest of Russia. However, it's important to note a sharp, uneven growth to the right of the second "hump," which appears anomalous compared to the rest of the graph. This growth may indicate possible instances of falsification. Some votes cast for Putin and marked with cross-hatching on the graph were identified by the algorithm as anomalous.
In order to assess the real result, one should pay attention to the course of Davankov's purple curve on the left graph. Up to 75% turnout his curve is about twice as high as the others, that is his outcome, he received the votes of about 11% of Russians. Putin, on the other hand, received just over 80% in the main cluster - this is the estimate of his result in the ballot boxes before stuffing and rewriting.
The right graph represents "clouds" of voting results, where each point on the graph corresponds to a polling station or ballot box. The color and size of the points may indicate various characteristics, such as voter turnout, the percentage of votes for a particular candidate or party, etc.
In general, clouds can be used to identify anomalies or unusual patterns in election results. For example, they can help identify polling stations with unusually high turnout, significantly different voting results from average indicators, or other patterns that may indicate possible irregularities or manipulation.
Points that significantly deviate from the general pattern of the "cloud" may indicate unusual or suspicious results. For example, a polling station with an exceptionally high voter turnout or an unusually high percentage of votes for a particular candidate might raise suspicions. Unusual groupings of points in the "cloud" may suggest localized efforts to manipulate results. For instance, if several polling stations in close proximity show identical or highly similar voting patterns, it could indicate organized fraud or manipulation.
Elections without violations appear as smooth "clouds", dense in the center and fading at the edges. However, on the given diagram, a so-called "comet tail" extends from the "cloud" of votes for Putin, directed upwards (while the "tail" of votes for other candidates goes downwards).
The "tail" is formed as a result of adding votes to the desired candidate, which simultaneously leads to an increase in voter turnout.
"Fuzzy clouds" with "tails" as on the right graph may indicate uncertainty or variability in the data. "Tails" may refer to extreme values, in probability distributions, "tails" may indicate the presence of rare events or anomalies – or rude falsification.
"This year's election is so 'messy' that standard methods of analyzing fraud work with limitations," researchers in the data department of the Novaya Gazeta.Europe wrote in their text.
Different statistical approaches make it possible to determine almost unmistakably the number of votes Putin received through trivial rewriting of the final protocols of precinct election commissions - there are 5.9 million of them (out of 22 million "anomalous" votes in total).
However, all experts emphasize that it is impossible to calculate Putin's actual electoral rating accurately. It is influenced by numerous factors that allowed the Golos movement to conclude that the 2024 presidential campaign was the most unfair in the history of modern Russia. These factors, among others, include violations of citizens' basic electoral rights, lack of public political discussion (military censorship and ban of independent media), repression of political opponents, coercion of voters to vote, abuse of remote e-voting, and many others. Therefore, falsification of election results is only the last of many steps on the path of electoral manipulation.
Without them, Putin's rating would hardly be above 30%, sums up Ivan Shukshin.